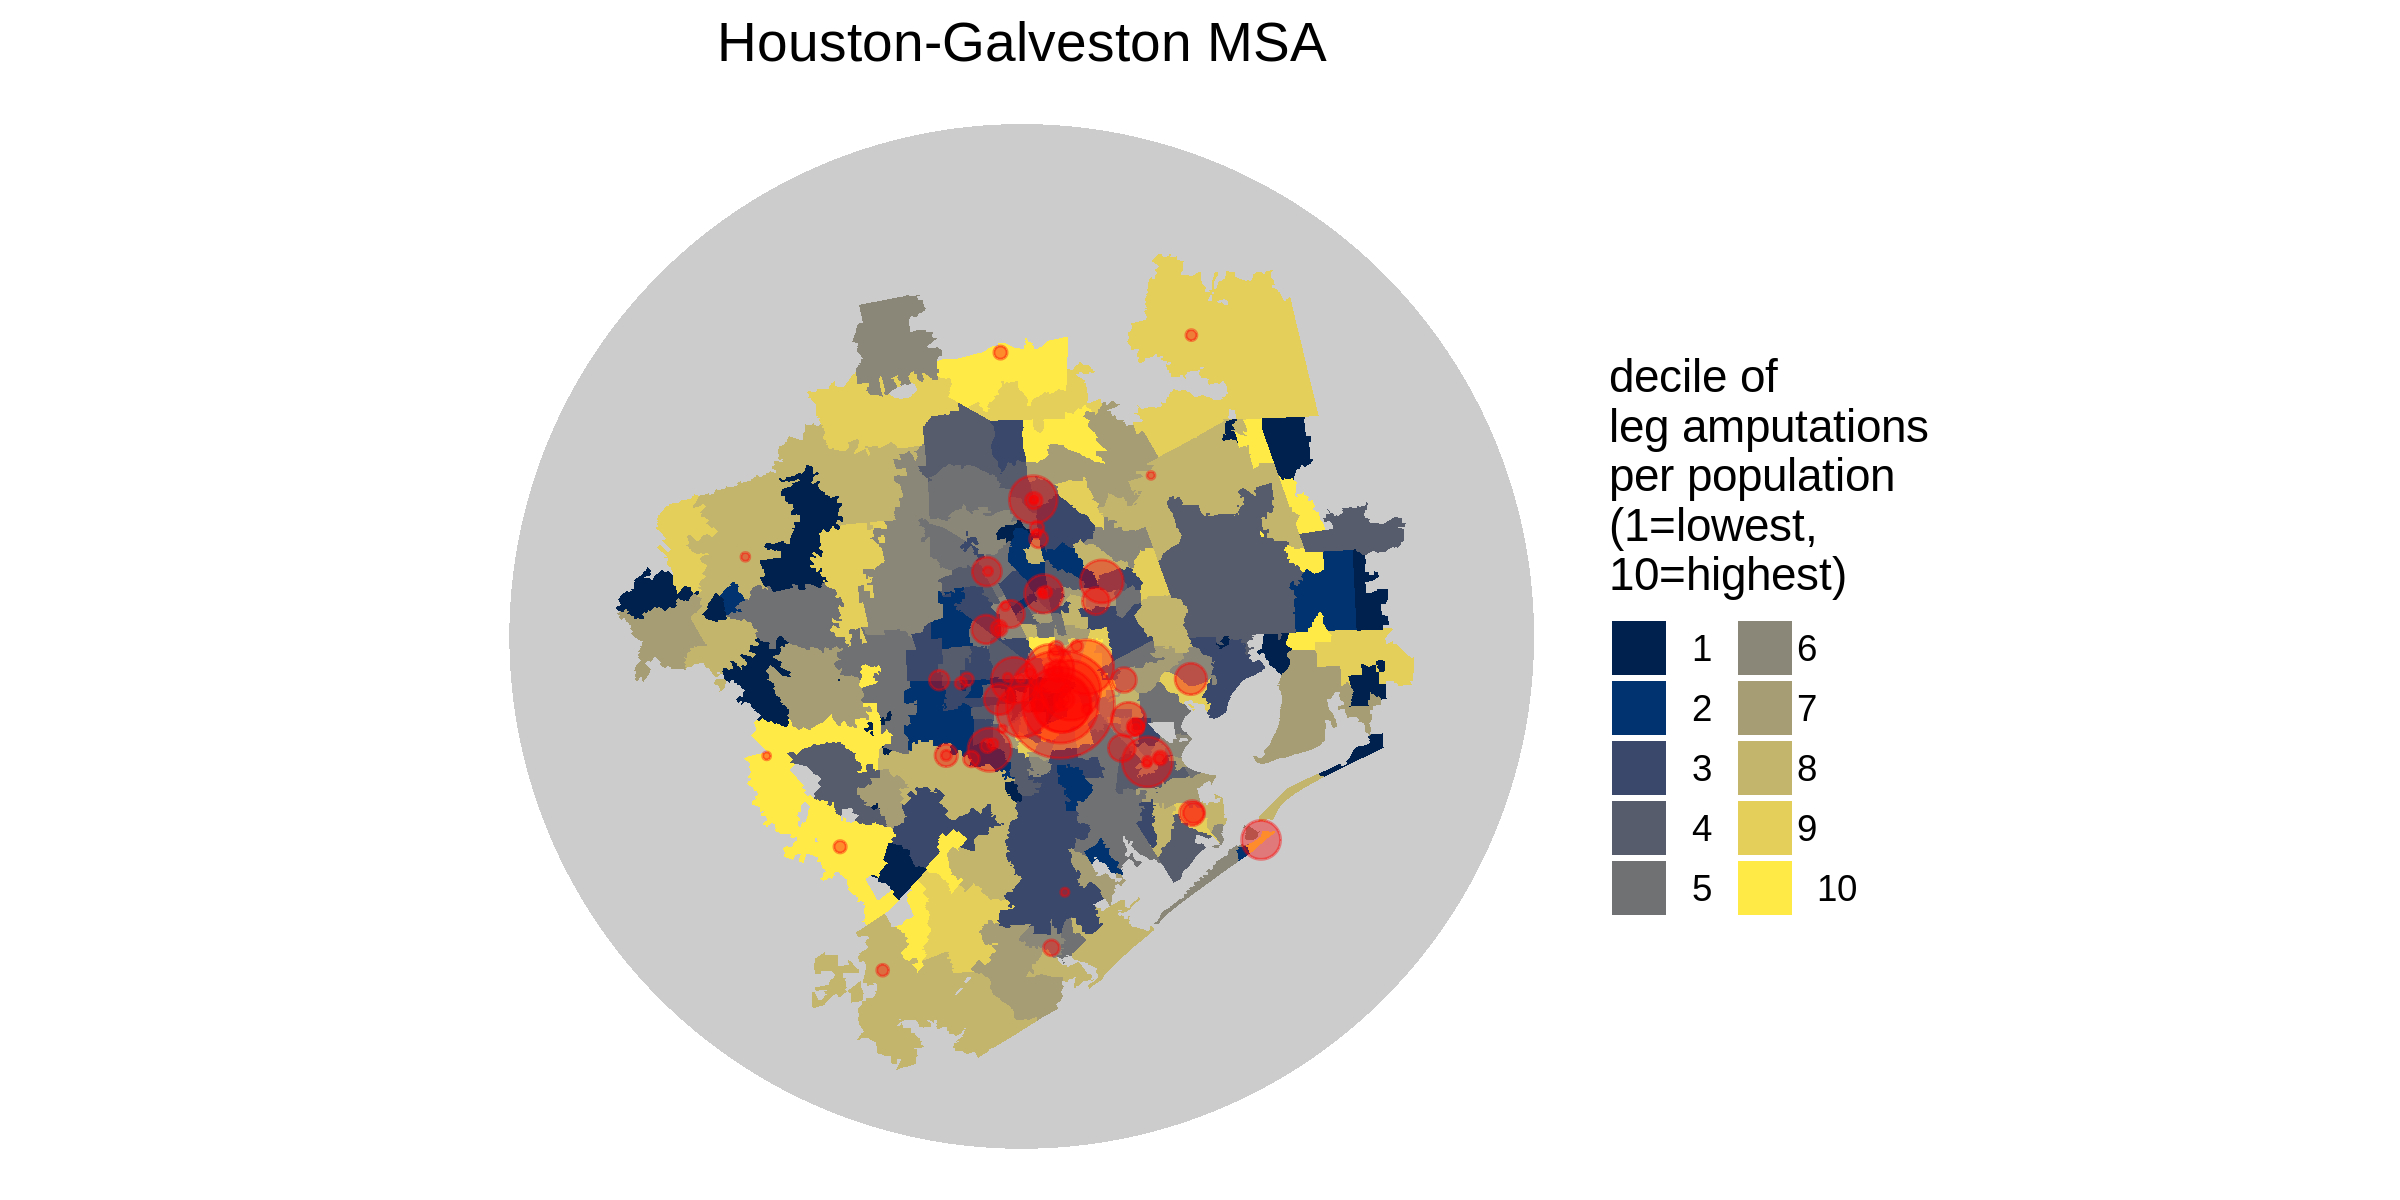
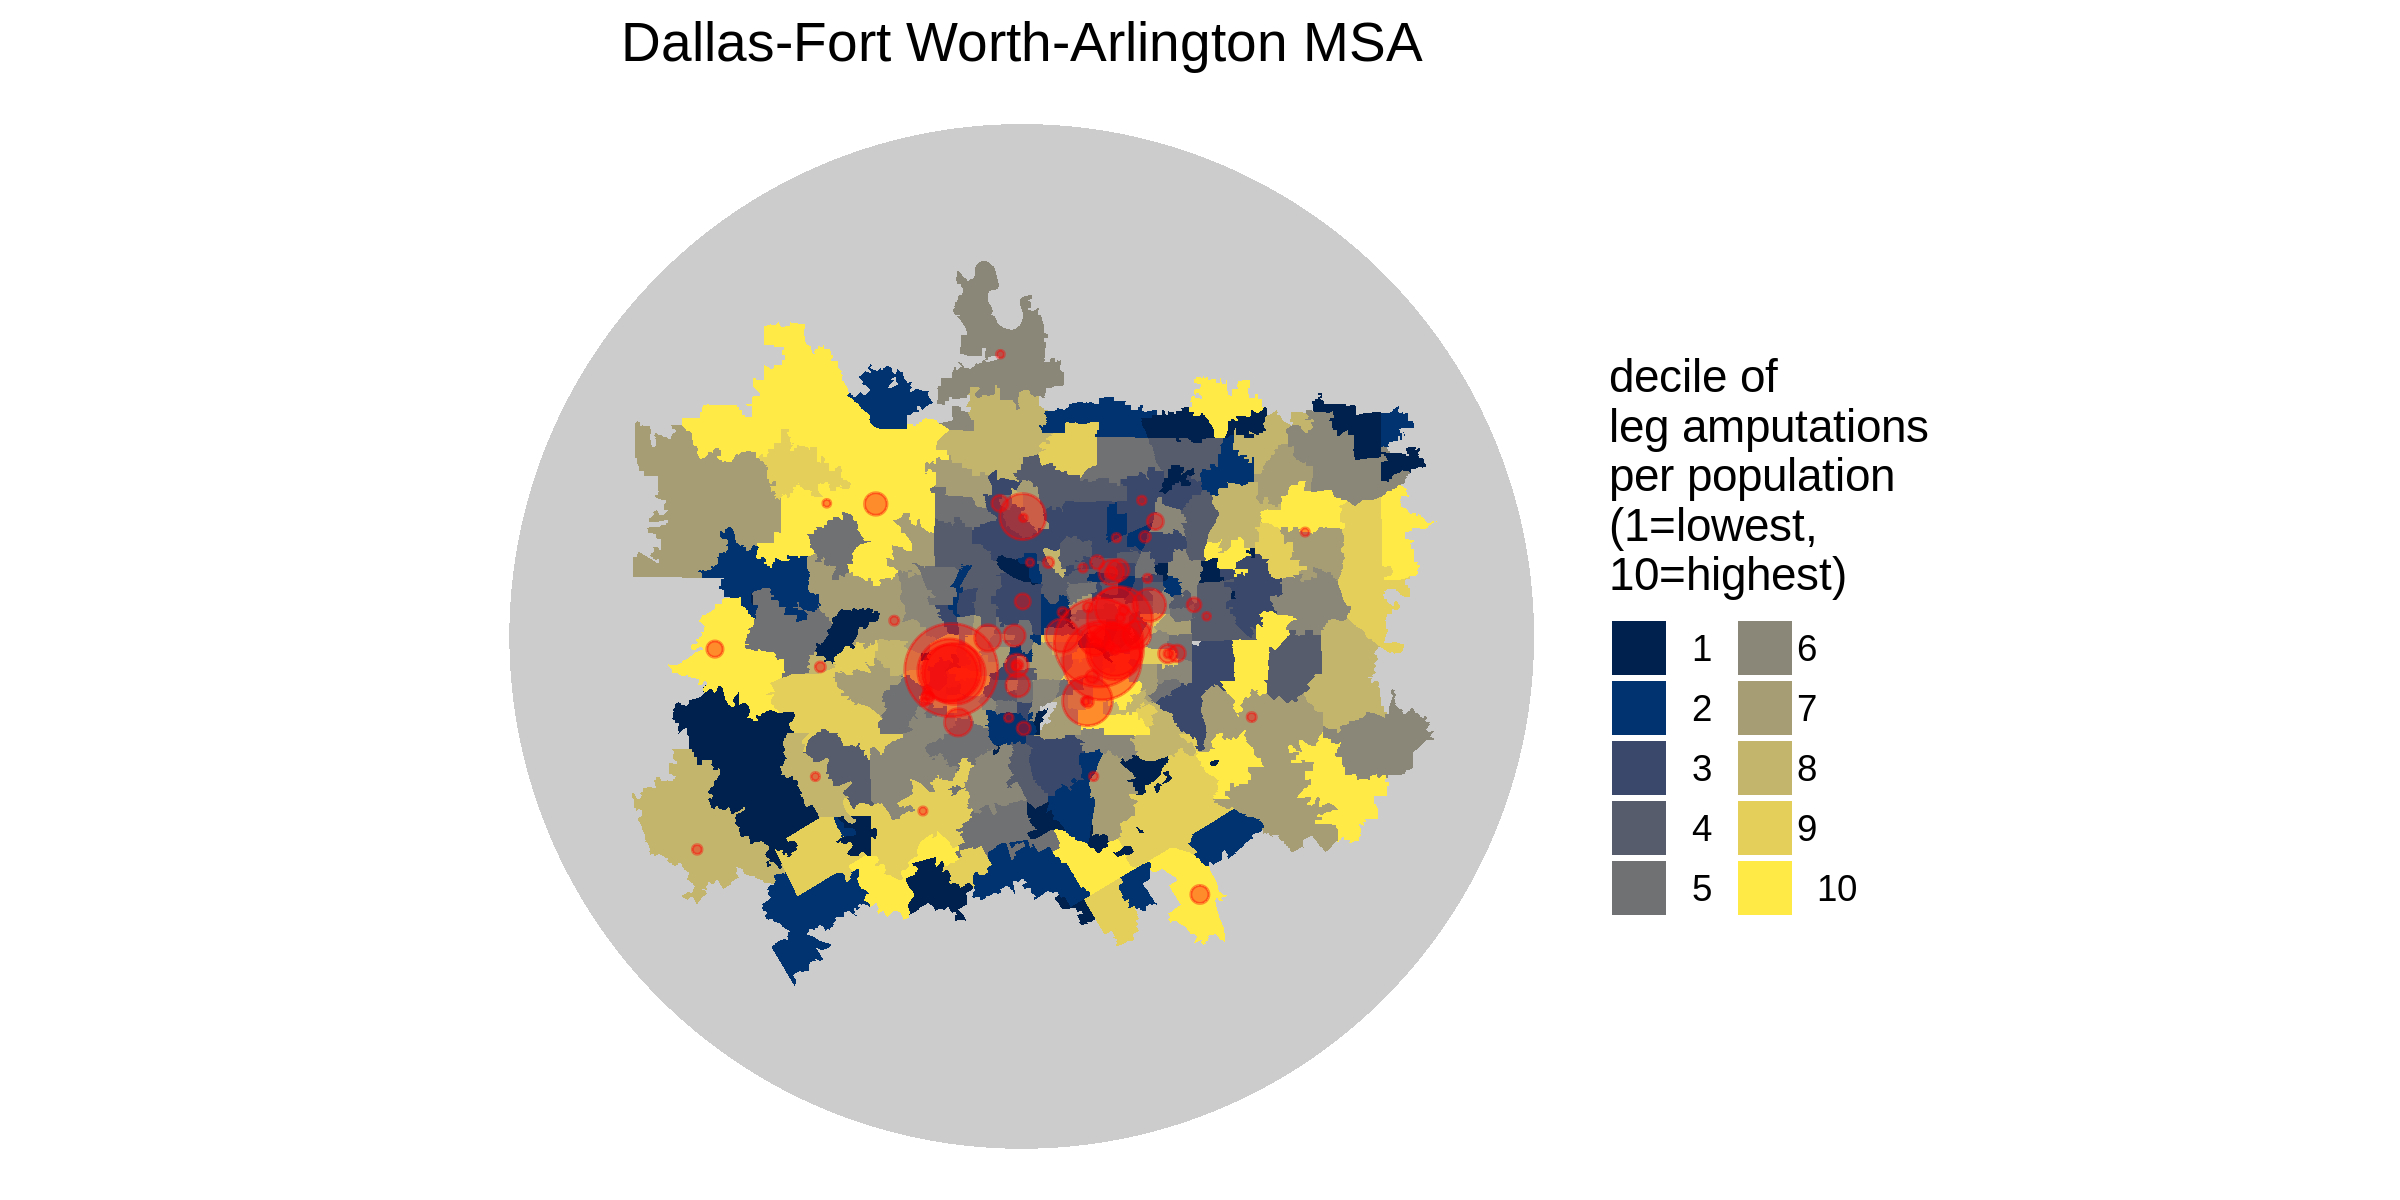
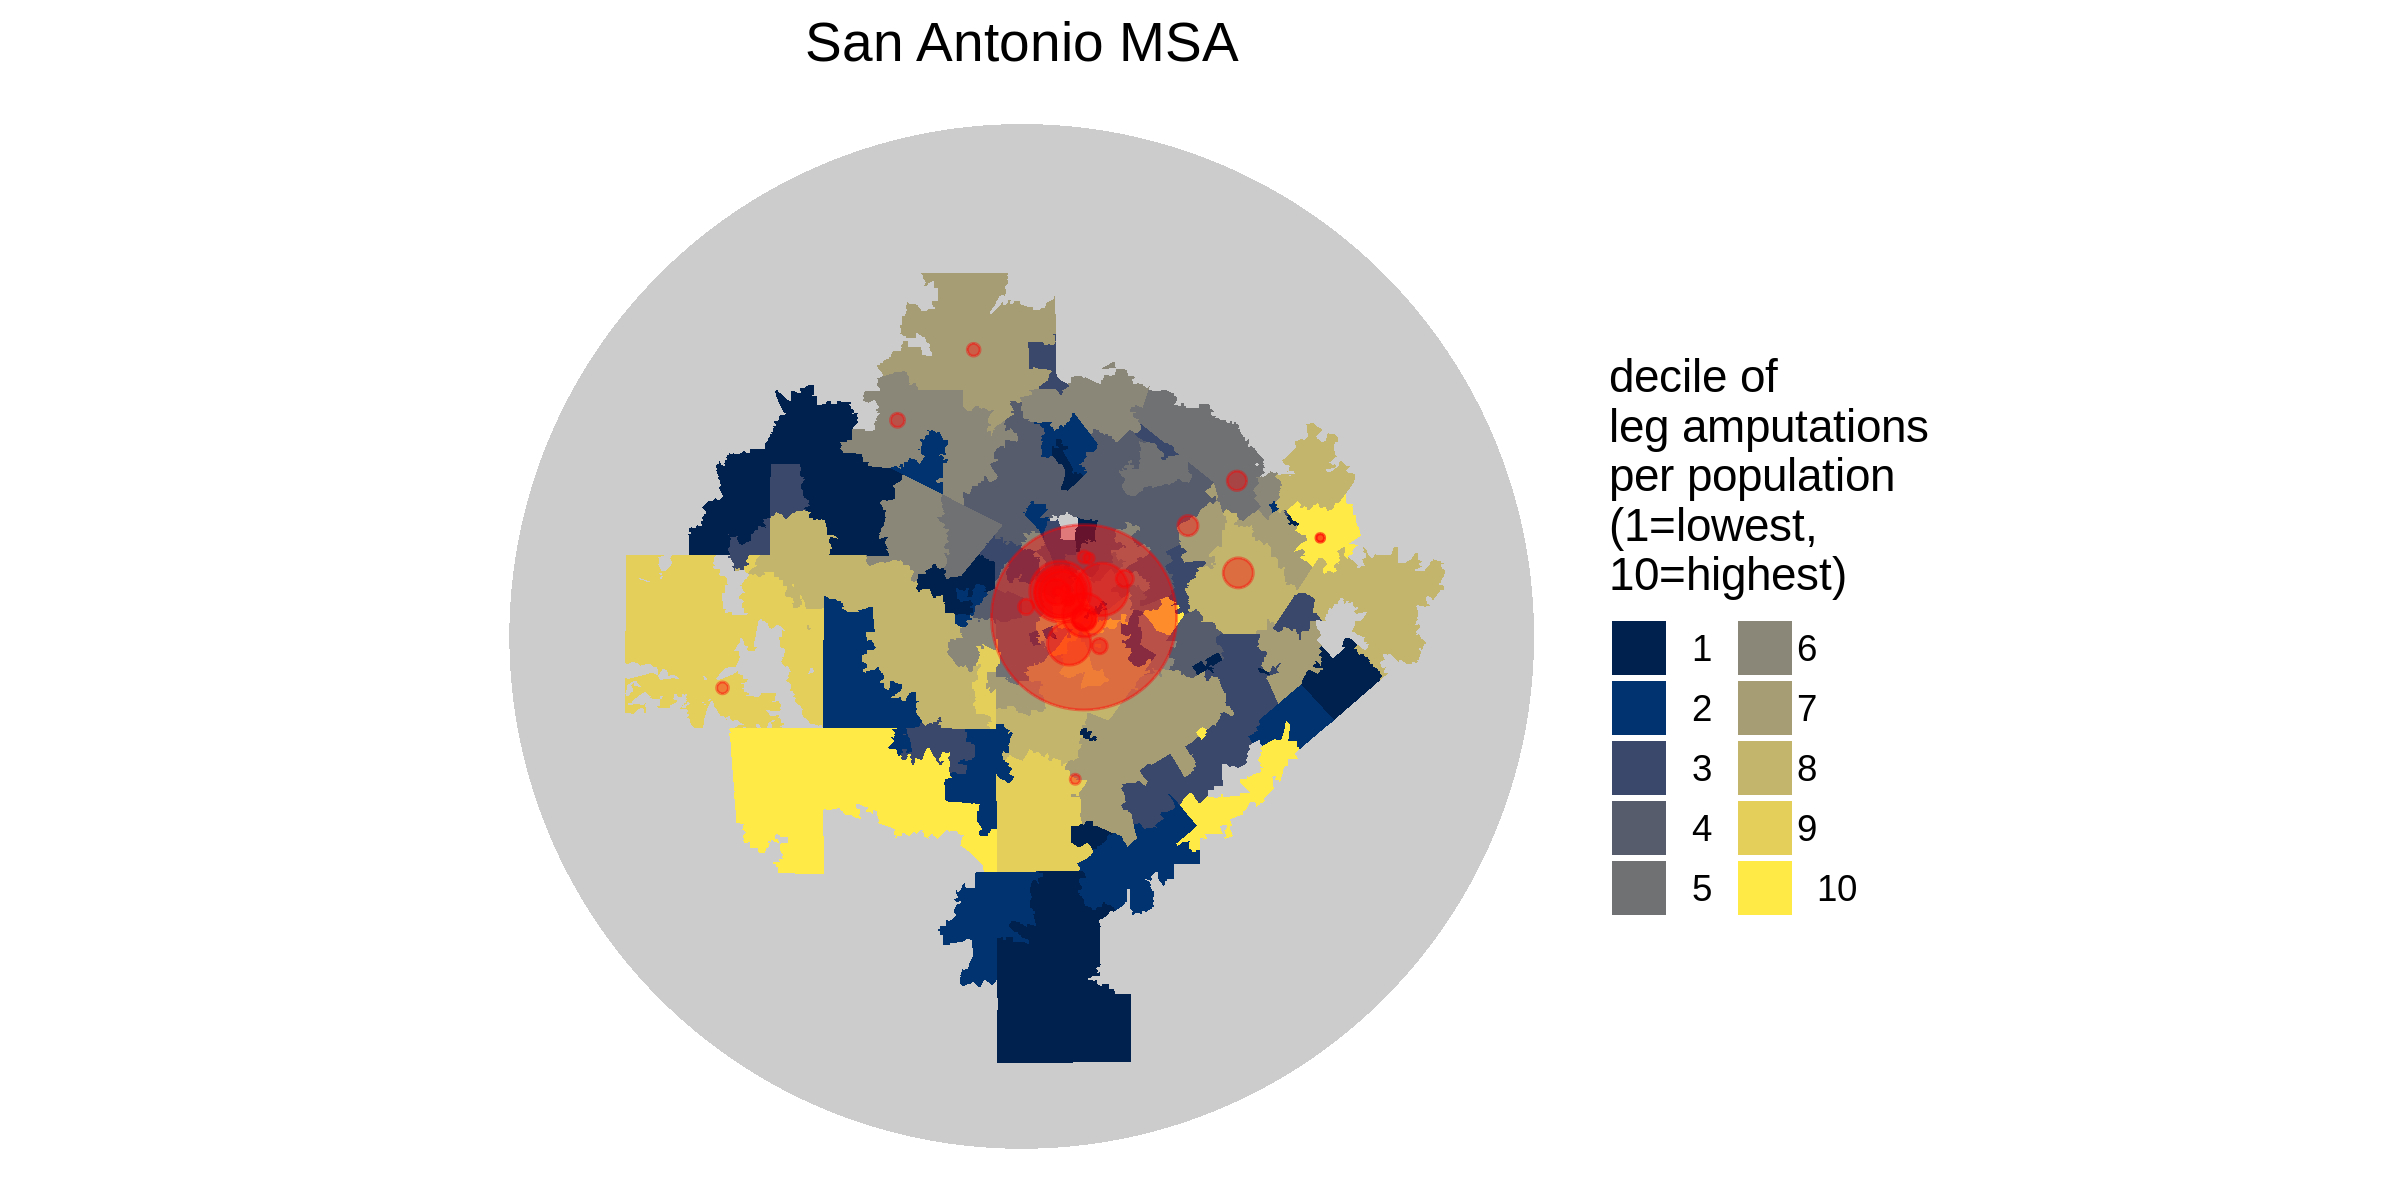
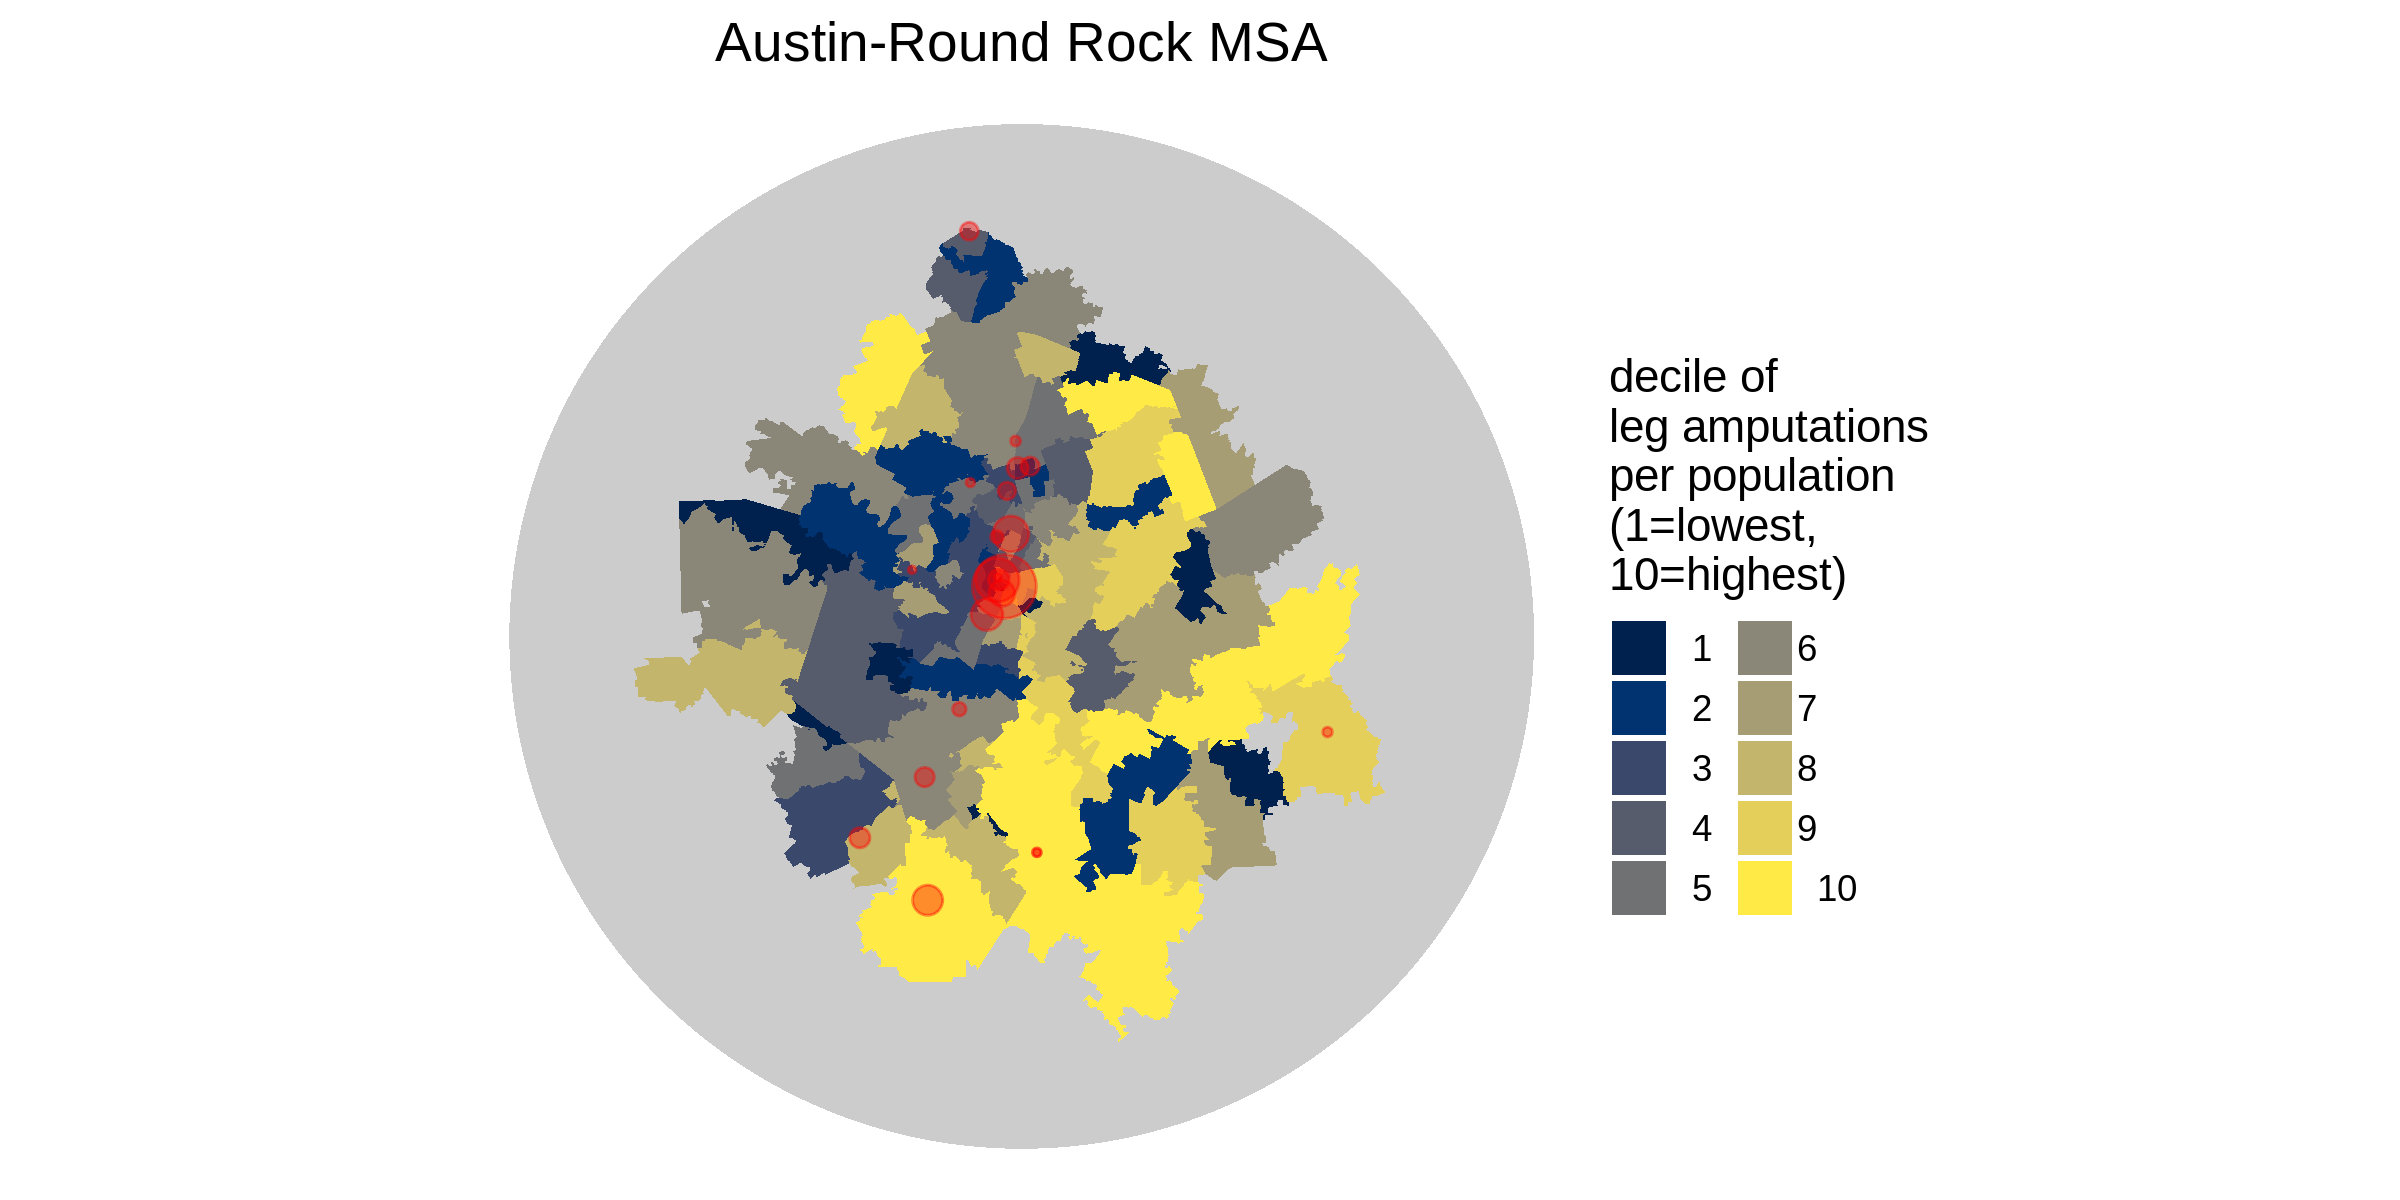
Per capita leg amputations among persons diagnosed with peripheral artery disease in Texas, 2010-2014
Per capita leg amputations among persons diagnosed with peripheral artery disease in Texas, 2010-2014
These maps show rates of leg amputations in the four largest metropolitan areas in the state of Texas. Specifically, the population displayed here are Texas with a diagnosis of peripheral artery disease AND a foot complication (foot ulcer, foot infection, foot gangrene) who underwent leg amputation at a non-federal Texas hospitals from 2010 through 2014. The rates displayed are per capita leg (above-ankle) amputation rates by zip code, color-coded into deciles. The location of red dots denote the location of hospitals where leg amputations have been performed, and the size of the circle denotes the leg amputation procedural volume at each of these hospitals.
Thank you to Kyle Walker and Deeksha Bidare for helping with the data analysis and coding that went in to these graphs!